MapDemand.ai insights
What live UK demand maps reveal about online retail
Online sales teams have no shortage of data. The challenge is seeing where performance is truly happening geographically. Postcode-level mapping turns static exports into a practical view of where demand clusters, where value concentrates, and where growth opportunities are being missed.
Why postcode-level demand matters for UK ecommerce
In UK online retail, demand does not spread evenly. Some postcodes and regions carry significantly more volume and value than others. London routinely concentrates a disproportionate share of orders, while parts of Wales, the South West, and rural Scotland often look weaker than they actually are simply because no one is mapping them carefully.
If your data only lives in tables, it is difficult to prioritise acquisition spend, stock placement, fulfilment, and store decisions by area. A geographic view helps commercial teams make faster, more confident regional decisions, and it surfaces opportunities that a row-by-row spreadsheet cannot.
Map 1: Regional revenue concentration
The first useful view is a regional choropleth showing where total online revenue is concentrated. It is the fastest way to align a leadership conversation around the question, "Where is the money actually coming from?".
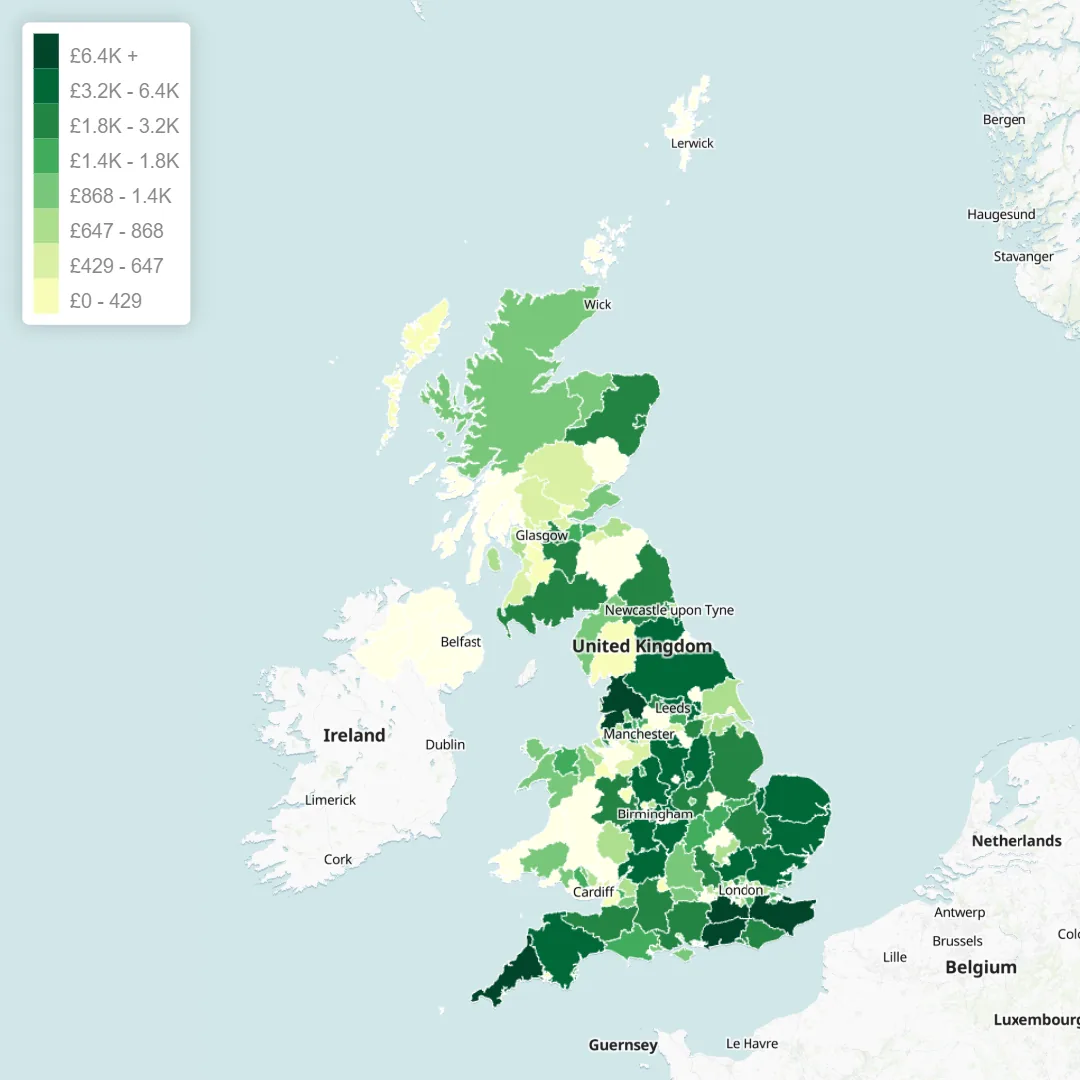
What this reveals
Strong regions stand out immediately, while weaker neighbours next to strong ones expose obvious whitespace. Comparing similar regions side by side often shows that perceived "low performers" are actually under-served, not low intent.
Commercial actions teams can take
- Prioritise paid acquisition in regions that already convert at a high revenue per order.
- Plan budget allocation by region instead of by national flat distribution.
- Identify under-served regions adjacent to strong ones for targeted growth tests.
- Brief merchandising and operations on which regions to protect first if stock or service is constrained.
Map 2: Postcode-level demand density
The second view shows raw order density rather than total value. It is useful for finding clusters, whitespace, and mismatches between marketing coverage and actual demand.
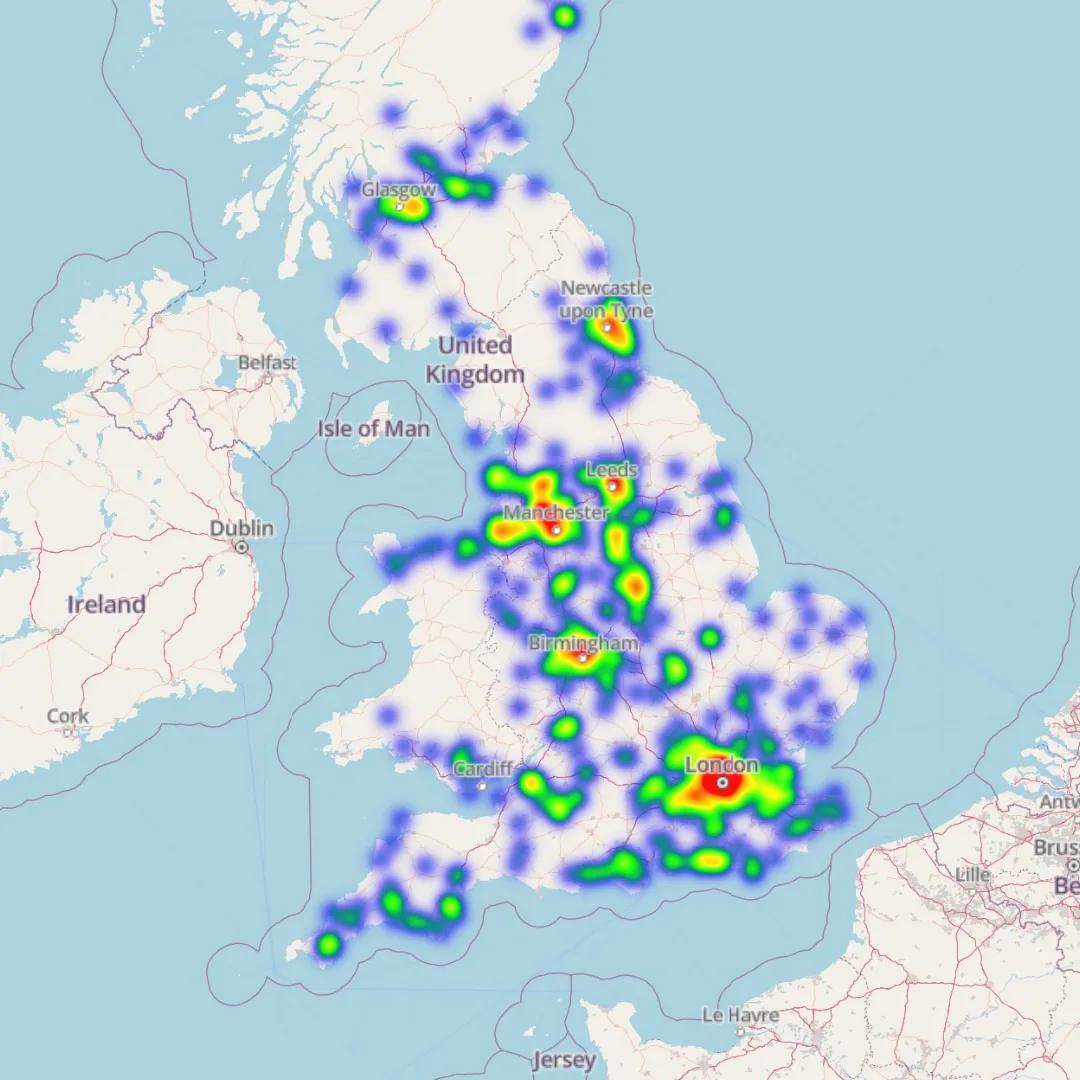
What this reveals
Demand clusters are often surprisingly tight. London is rarely a single hotspot, it is several. Manchester, Leeds, Birmingham, and Glasgow each show their own concentration patterns. Areas that look strong in revenue terms can still have surprisingly low order counts, signalling fewer but higher-value customers.
Commercial actions teams can take
- Match local marketing coverage to where the actual demand sits, not where you assume it sits.
- Plan delivery network density and last-mile partners around real volume clusters.
- Use density gaps to test new geographic markets with smaller, more confident pilots.
- Help finance and operations teams pressure-test capacity assumptions by region.
Map 3: Product and region fit
The third view splits regions by their dominant product or category. This is where merchandising and growth teams find the strongest commercial leverage.
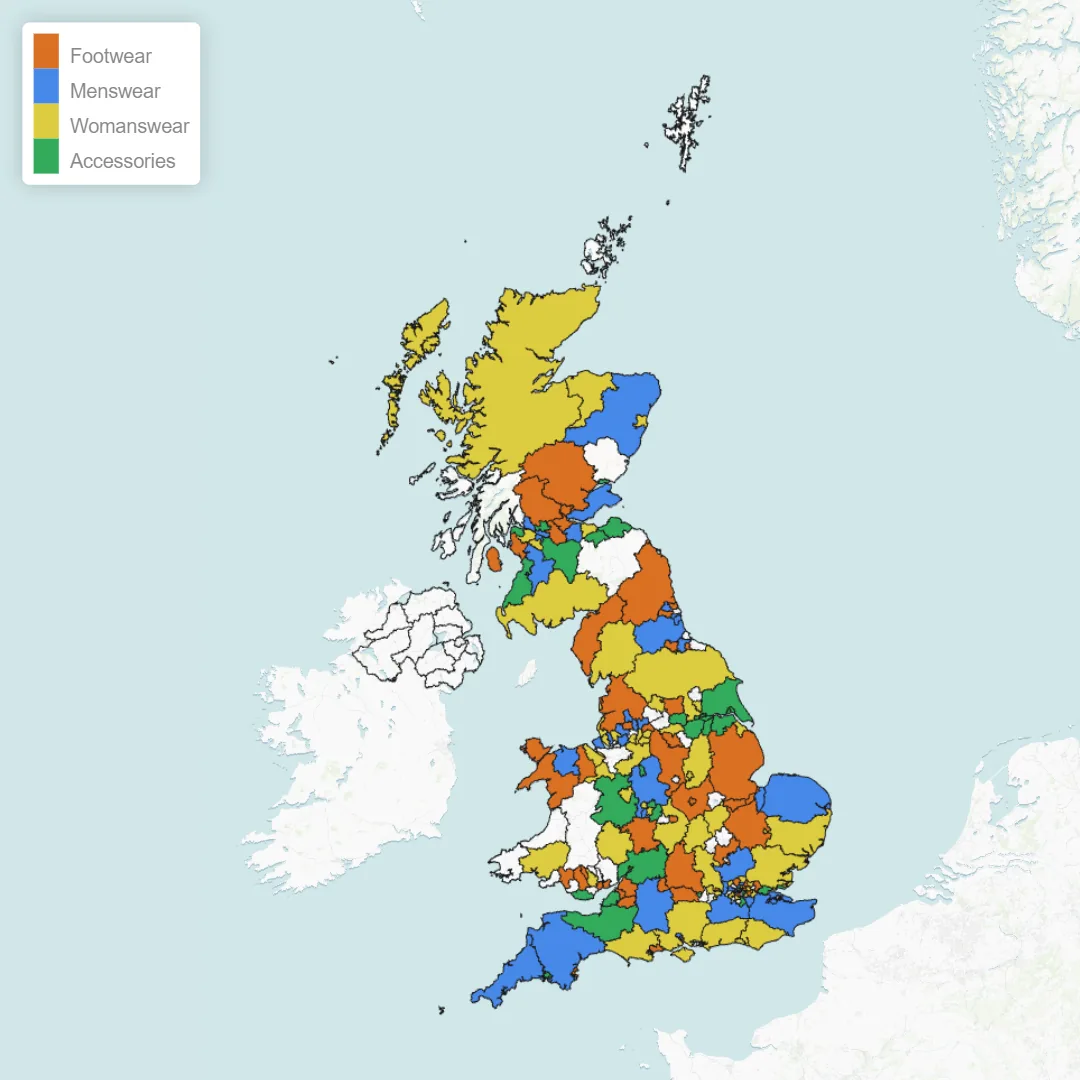
What this reveals
Categories rarely sell evenly. Some regions over-index for footwear, others for menswear or womenswear, others for accessories. The same product can be a hit in one region and quietly underperform in another that looks superficially similar on a national report.
Commercial actions teams can take
- Tailor regional campaigns and creative to the categories that actually convert there.
- Allocate stock and replenishment by region-category fit rather than national averages.
- Brief merchandising and buyers on regional preferences when planning new ranges.
- Spot regions where a category is under-represented relative to comparable areas, which often signals a growth bet.
Map 4: Local postcode order detail
Zooming into a single city makes the picture concrete. The fourth view shows individual postcode value alongside markers for actual orders, in this case a London-area example.
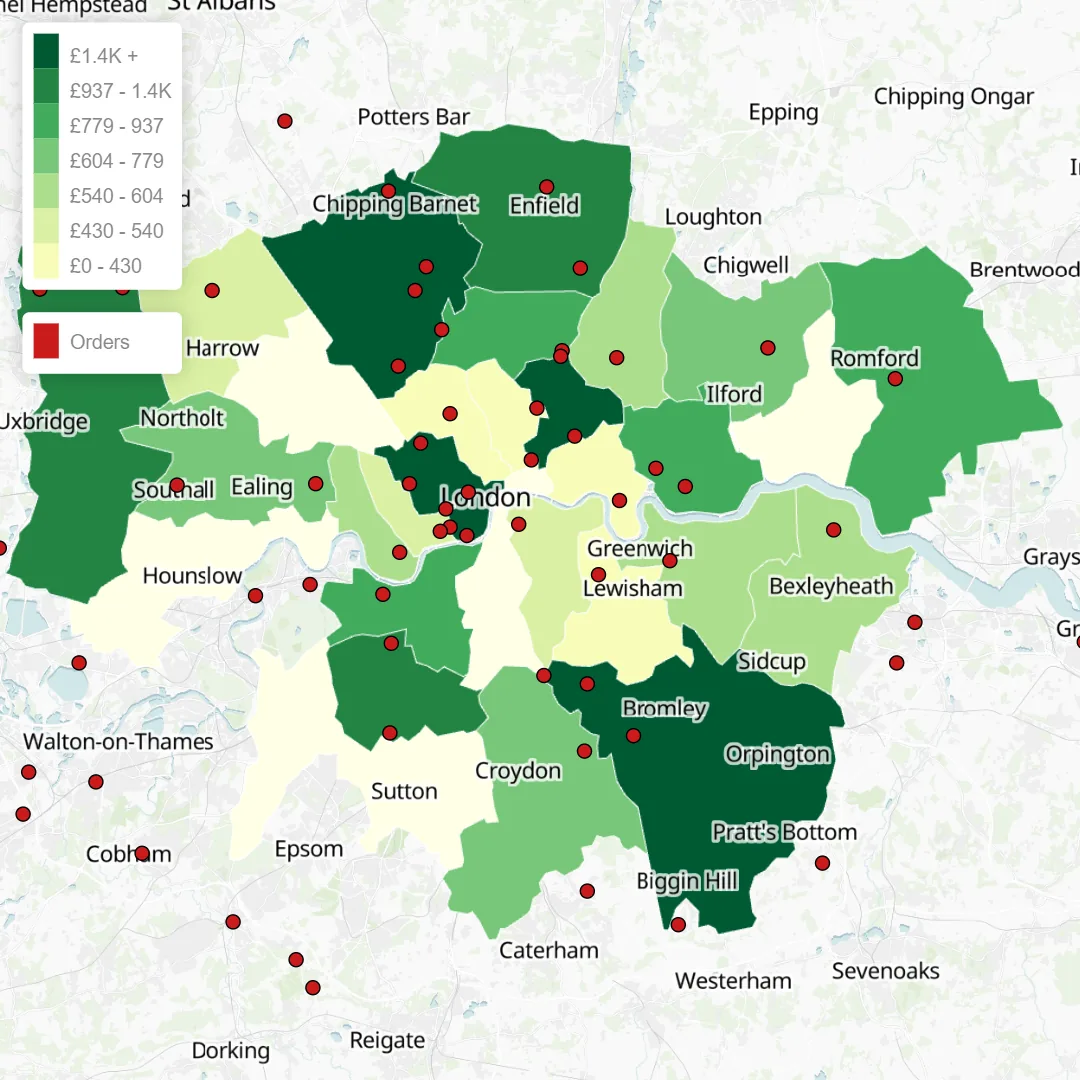
What this reveals
Within a city, value is rarely uniform. Outer-borough postcodes such as Bromley, Orpington, and Enfield can punch well above their share of total order count when measured by basket value. Central postcodes often show high order frequency but lower per-order revenue. Both patterns are commercially relevant for different reasons.
Commercial actions teams can take
- Plan store catchments and click-and-collect points around real postcode demand, not council boundaries.
- Set delivery zones, fees, or thresholds based on actual local economics.
- Identify high-value postcodes for targeted retention or premium-tier offers.
- Spot quiet neighbouring postcodes where a small acquisition push could raise overall demand.
Questions to ask your demand map
- Where should we expand next in the UK?
- Which areas have the highest total revenue in the UK?
- Which postcodes generate the most orders in the UK?
- Where are the biggest geographic gaps in our coverage in the UK?
- Which regions over-index for our top product compared to average?
- How is demand distributed across the UK?
- Which neighbouring regions have very different revenue performance?
- Where do high order volume and high order value overlap?
For more prompt examples, see the homepage Chat with your map section.
What data do you need?
You do not need a complex BI setup to start. A simple export from your ecommerce, CRM, order management, or reporting tool is usually enough.
The most useful fields are:
- Customer postcode
- Order count
- Revenue
- Product category
- Sales channel
- Order date
If you only have a subset of these, you can still build a meaningful regional view. Postcode plus revenue is enough for the first map.
Frequently asked questions
What sales data do I need to generate UK demand maps?
A practical starting point is a CSV with customer postcode, order totals or revenue, and ideally product category and channel. With those fields you can build the regional revenue, demand density, and category views shown above.
Does MapDemand.ai support UK postcode analysis?
Yes. Postcode-level visibility is a core use case for understanding where online demand is concentrated and where coverage gaps exist.
Can I ask commercial questions against my map data?
Yes. MapDemand.ai is being built to support plain-English map questions, such as where demand is growing, where coverage is thin, and which regions produce the most value.
Are the maps in this article using real customer data?
No. The maps shown use sample or anonymised data for demonstration purposes only.
Get early access to MapDemand.ai
If your team needs clearer UK demand visibility, get early access and help shape the first release of MapDemand.ai.