
MapDemand.ai guide
What makes a demand hotspot useful for planning
Heat maps make demand easy to see. A bright patch on the map feels like an answer. The useful part for planning is not the colour alone, but what that cluster represents when you hold it next to revenue, coverage, category mix, and time. This article sets out how UK ecommerce and omnichannel teams can use hotspots without mistaking noise for strategy.
What a hotspot is, and what it is not
A demand hotspot is a tight geographic cluster where order or revenue intensity reads higher than neighbouring areas at a fine scale, often postcode or small-area level. It is not the same as a whole region scoring well on a national report, and it is not proof of unlimited upside. It is a signal that customers in that place are showing up in your data in a concentrated way.
That distinction matters because planning actions differ. A regional summary might justify a broad budget shift, while a hotspot often supports a local intervention, a delivery or service check, a focused creative test, or a conversation about whether you are already saturating that pocket of demand.
Why hotspots help when tables do not
Spreadsheets can rank postcodes, but they rarely carry spatial context. Two postcodes with similar totals can sit in completely different commercial situations if one sits inside a dense urban cluster and the other is an isolated spike surrounded by quiet areas. A heat map carries that neighbourhood relationship in one glance, which is why it pairs well with the regional views described in our demand maps walkthrough and the revenue and coverage method in prioritising regions.
Example view: order density across the UK
The example below shows how order density can cluster in ways that do not line up with simple assumptions about entire cities or counties.
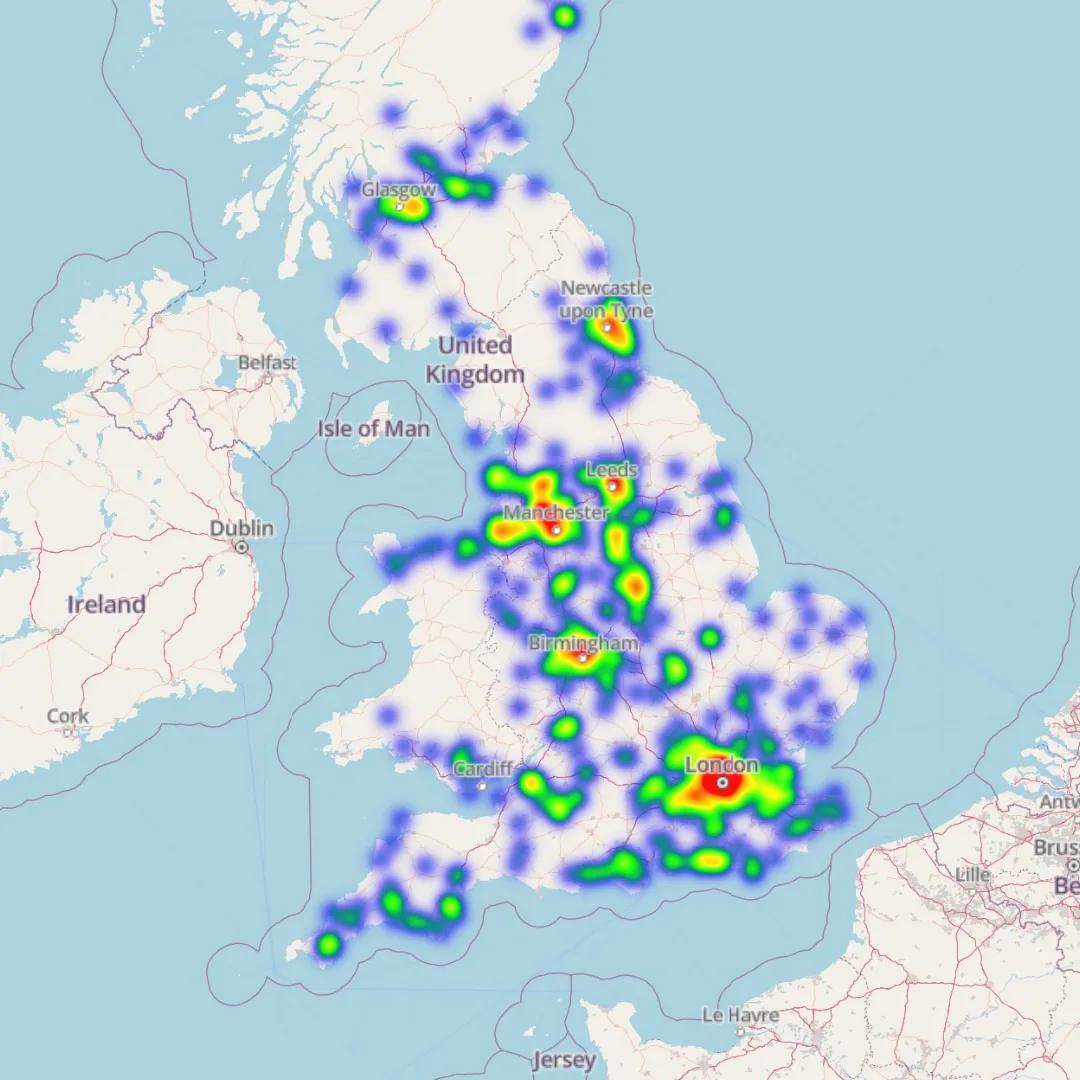
Example maps shown use sample or anonymised data for demonstration purposes.
What to read alongside the hotspot
Hotspots become useful for planning when you layer at least one other lens:
- Value. High order count with weak revenue per order points to a different playbook from fewer orders with strong basket economics.
- Coverage. A bright patch where you already spend heavily, stock generously, and deliver quickly is different from the same shape where fulfilment or marketing reach is thin.
- Category. The hotspot for one range may sit in a different place from the hotspot for another, which matters for merchandising and geo-targeted campaign planning.
- Time. A short window can exaggerate promotions, stockouts elsewhere, or weather. A stable twelve-month view usually supports bolder decisions than a single campaign week.
When those lenses agree, you have a stronger case for stock placement, local acquisition tests, or partnership conversations. When they disagree, the hotspot is still useful, because it tells you where to investigate rather than where to declare victory.
Planning actions that hotspots support well
Hotspots are best treated as inputs to focused decisions, not as a full strategy on their own. Teams often get the most from them when they connect the map to a short list of actions:
- Align local paid social or search radius tests to real density rather than administrative boundaries.
- Pressure-test delivery cut-offs, surcharges, or carrier choices where volume concentrates unexpectedly.
- Pair hotspot shape with whitespace analysis to see whether neighbouring areas are quiet because of weak demand or weak presence.
- Give operations and finance a single visual when arguing for capacity or inventory in specific corridors.
Outcomes are never guaranteed from a map alone. The benefit is faster alignment on where to look first.
Questions to ask before you act on a hotspot
- How many orders sit under this patch, and how does that compare with last period?
- Is revenue per order here above or below our UK average?
- Did a campaign, influencer send, or stock issue distort the window?
- Are returns or cancellations different here than in similar hotspots?
- Does this pattern still appear when we split by category or channel?
For more prompt-style questions you can adapt to your own data, see the homepage Chat with your map section.
Frequently asked questions
What counts as a demand hotspot on a sales heat map?
A demand hotspot is a geographically tight cluster of orders or revenue that stands out against nearby areas on a heat map, usually at postcode or small-area scale rather than whole-region totals alone.
Why can two hotspots lead to different planning decisions?
One hotspot might reflect high order volume with modest basket size, while another reflects fewer orders but stronger revenue or margins. They can also differ by category mix, returns behaviour, or how well your delivery promise matches local expectations.
When should teams treat a hotspot cautiously?
Treat a hotspot cautiously when sample size is small, when a single campaign or stockout skewed a short time window, or when marketing spend was concentrated in that geography so demand was purchased rather than organic.
Can MapDemand.ai help teams interpret hotspots from their own exports?
Yes. MapDemand.ai is being built so teams can upload UK sales data, explore hotspot-style heat maps alongside regional views, and ask grounded questions about where density and value align.
Get early access to MapDemand.ai
If you want hotspot and regional views on your own UK sales data, join the waitlist and help shape the first release.