
MapDemand.ai guide
Turning sales exports into map-ready datasets
Most UK retail teams already have the data they need for demand mapping sitting in an export somewhere. The blocker is rarely access. It is shape. Postcodes arrive in five formats, revenue sits in a column with currency symbols, and nobody agrees whether each row is an order, a customer, or a postcode total. This guide walks through how to prepare a sales CSV so maps load cleanly and the numbers stay trustworthy.
Why export hygiene matters before you open a map
A map is only as honest as the rows behind it. When postcodes fail to match, those orders vanish from the view. When grain shifts between refreshes, last month's hotspot disappears because the file structure changed. When category labels drift, product-by-region views look broken even though sales were fine.
Getting the export right once saves rework across every map type you plan to use, from regional filled views to postcode heat maps. It also makes conversations with finance, operations, and marketing easier because everyone is looking at the same definitions.
Start with the fields that unlock the most views
You do not need a perfect data warehouse to begin. A simple extract from ecommerce, order management, CRM, or a reporting tool is enough when it includes a short list of reliable columns:
- Customer or delivery postcode
- Revenue
- Order count or order ID
- Order date or period
- Product category or SKU
- Sales channel
Postcode and at least one numeric measure are non-negotiable for geographic views. Date lets you filter promotions and seasonality. Category and channel unlock the split views described in our demand maps walkthrough and the UK retail data analytics guide.
Optional columns such as average order value, customer segment, campaign source, or a repeat-purchase flag add depth when your policies allow them. They are useful for segmentation by location, not prerequisites for a first map.
Get UK postcodes into one consistent format
Postcode quality is the fastest win. UK outward and full postcodes should be uppercase, with a single space before the inward code where the full postcode is available. Trim leading and trailing spaces, remove tabs, and strip currency or text accidentally pasted into the postcode column.
Common fixes teams apply before upload:
- Replace missing values with a blank rather than placeholders such as "N/A" or "unknown" that geocoders treat as literal text.
- Separate billing and delivery postcodes when they differ. Maps about fulfilment and delivery promise should use delivery.
- Flag non-UK rows rather than mixing them into a UK map. Channel Islands, BFPO, and ROI orders need a conscious decision.
- Keep a lookup of corrected postcodes so the next export inherits the fix instead of repeating manual work.
When postcodes are clean, fine-grained views such as postcode order totals become possible. The example below shows the kind of local detail that depends on trustworthy geography.
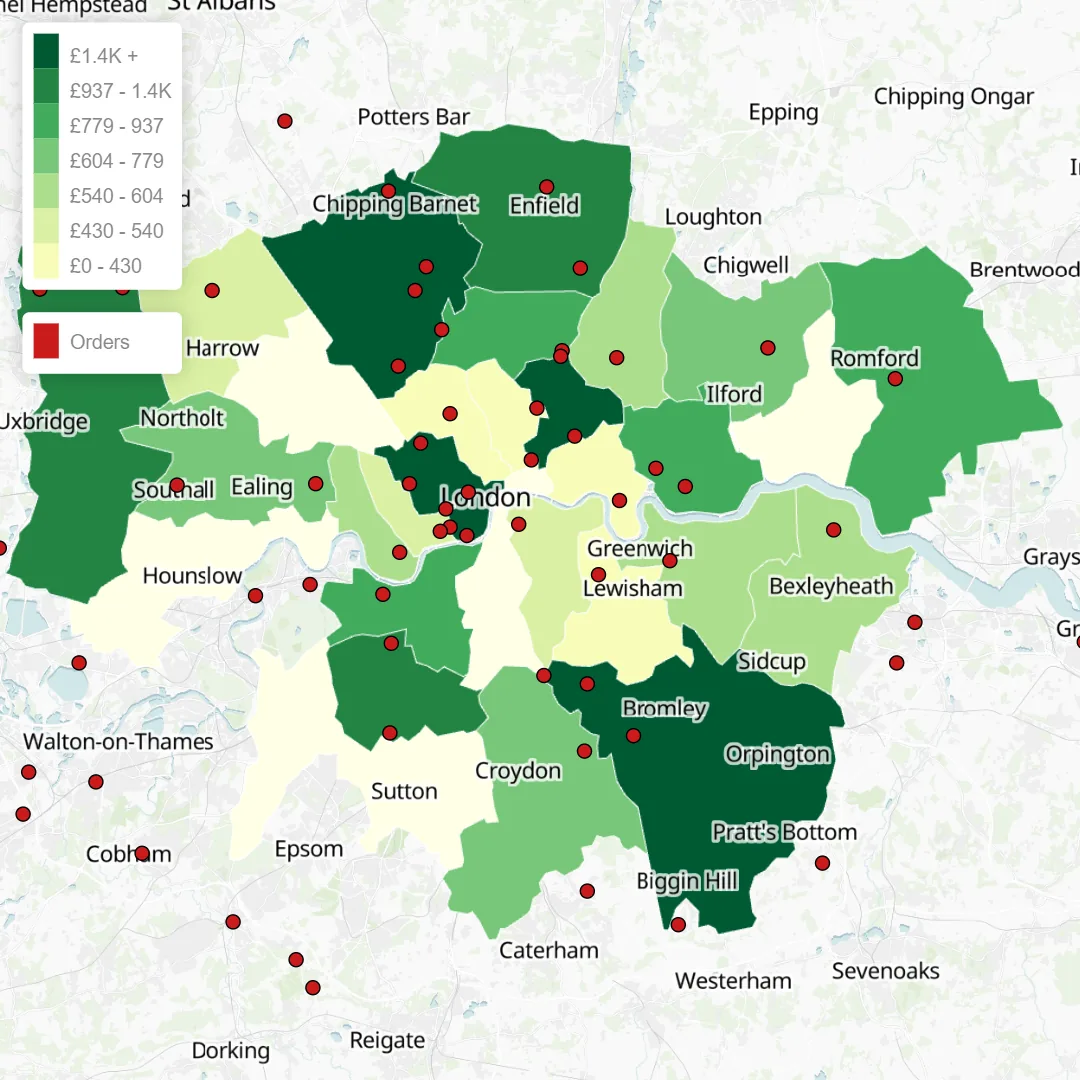
Example maps shown use sample or anonymised data for demonstration purposes.
Pick a row grain and stick to it
Every row should represent one thing. Mixed grain is the silent killer of map refreshes.
- One row per order. Flexible for date and category filters. You aggregate inside the mapping tool or in a pivot before upload.
- One row per postcode per period. Fast to validate and lighter to share. Harder to re-slice without a new export.
- One row per postcode per category. Useful for product-by-region work described in the analytics guide. Requires stable category labels.
Pick one grain, document it in a short data note, and keep column names stable across weekly or monthly refreshes. If you change grain, treat the next map as a new baseline rather than comparing directly to last month.
Make numbers and dates map-friendly
Revenue and order count columns should be plain numbers without currency symbols, thousands separators, or trailing text. Dates should use a consistent format, ideally ISO YYYY-MM-DD, and sit in one column rather than split across day, month, and year fields.
Before upload, sanity-check a handful of totals against a trusted report. If regional revenue on the map does not match finance within a reasonable rounding gap, the issue is usually duplicate rows, cancelled orders still included, or tax and shipping counted differently between systems.
Keep category and channel labels stable
Retail systems rename categories often. "Footwear" becomes "Shoes & Boots" after a merchandising tidy-up, and two channels merge mid-quarter. For maps, stable labels beat perfect taxonomy. Maintain a simple mapping table from raw export values to the names you want on the map, and apply it every refresh.
Channel splits matter when online and store behaviour diverge geographically. They also help when interpreting demand hotspots alongside campaign spend, because a hotspot driven by one channel may need a different follow-up from a blended spike.
Define a sensible time window
Most planning maps start with a rolling twelve-month window or a full financial year. Shorter windows suit campaign post-mortems. Longer windows smooth seasonality but hide recent shifts.
Whatever you choose, record the start and end dates in the file name or an accompanying note. That small habit prevents the classic meeting question, "Which period is this map actually showing?"
Common export mistakes to catch early
- Exporting billing postcode when delivery drives fulfilment insight.
- Including cancelled or fully refunded orders without a flag column.
- Mixing B2B and D2C in one file when their geography means different things.
- Using free-text city or county instead of postcode when postcode is available.
- Changing column headers between refreshes so automated loads break silently.
- Sharing identifiable customer fields in a file meant for a wider internal audience.
A ten-minute checklist before upload catches most of these. Compare row count, total revenue, and distinct postcode count against the prior refresh. Large swings usually point to a filter or grain change, not a genuine market shift.
Governance and privacy
Map-ready does not mean over-sharing. Remove direct identifiers you do not need for the analysis, such as names, email addresses, and full payment references. Use internal segment codes rather than raw labels when policies require it.
MapDemand.ai is designed to work from transactional fields you already hold under your contracts. There is no bundled third-party demographic enrichment in pre-launch. If you add segment or attribute columns, confirm they are permitted for the audience viewing the map.
A simple pre-upload checklist
- Postcodes uppercase, trimmed, and UK-scoped for a UK map.
- One documented row grain with stable column names.
- Numeric revenue and counts without formatting characters.
- Consistent date range recorded in the file name or notes.
- Category and channel labels mapped to stable display names.
- Totals reconciled against a trusted report.
- Personal data reduced to what the analysis requires.
Once the export passes that list, you are ready to explore regional views, compare revenue with coverage using our region prioritisation method, or test whitespace hypotheses with more confidence in the underlying rows.
Frequently asked questions
What is the minimum UK sales export needed for a useful demand map?
At minimum you need a UK postcode or outward code per row, a numeric measure such as revenue or order count, and a stable time window. Product category, channel, and customer segment columns add depth but are not always required for a first regional view.
Should exports be one row per order or aggregated by postcode?
Both can work. Order-level rows preserve flexibility for later filtering by date or category. Pre-aggregated postcode totals load faster and are easier to sanity-check, but you lose the ability to slice without exporting again. Pick one grain, document it, and keep column names consistent across refreshes.
Why do messy postcodes break map quality?
Mixed formatting, missing spaces, lowercase letters, or non-UK values prevent reliable geocoding. Rows that fail to match drop off the map silently or cluster in the wrong place, which makes hotspots and regional totals look weaker or stronger than they really are.
Can MapDemand.ai accept the CSV exports teams already use?
Yes. MapDemand.ai is being built for CSV-style extracts from ecommerce, order management, CRM, and reporting tools. Clean postcodes and consistent column meanings matter more than a bespoke template.
Get early access to MapDemand.ai
If you want to upload a prepared UK sales export and explore regional and postcode demand maps, join the waitlist and help shape the first release.