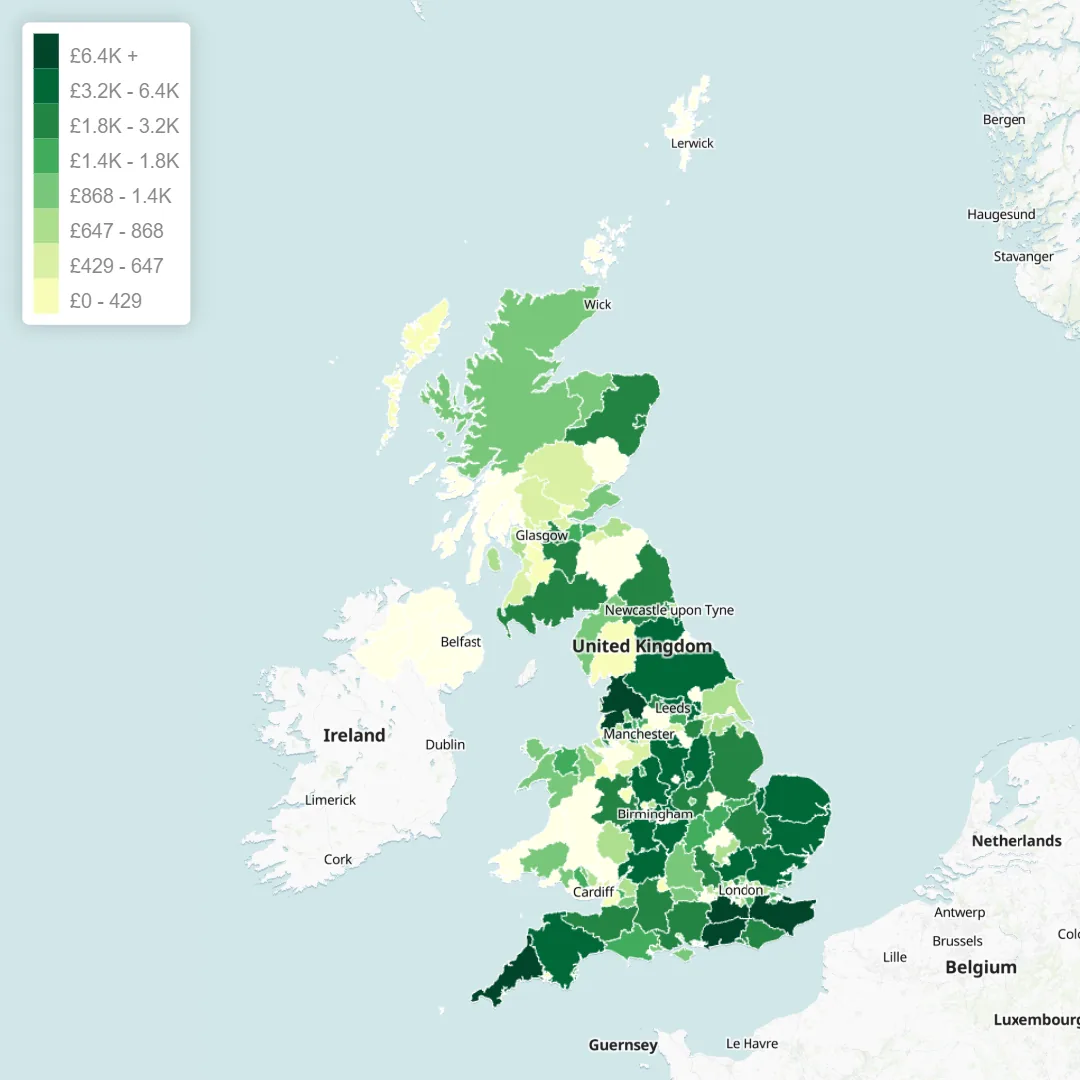
Revenue and orders by postcode or region
Plot concentration, tails, and quieter catchments from the same revenue and order fields you use in reporting.
AI-powered UK retail data analytics
MapDemand.ai is designed as AI-powered retail data analytics for UK teams, helping you turn postcode, regional, product, and channel exports into practical location insight that complements your existing dashboards and spreadsheets.
UK ecommerce and omnichannel performance rarely moves in one national line. Fulfilment cut-offs, local assortment, and channel mix all vary by place. When analytics stays tabular, debates about where to focus trading or marketing spend start from different mental models. A shared map layer keeps those conversations tied to the same export definitions your analysts already use.
Get early access to postcode sales analysis, product demand insight, customer segmentation and regional performance views.
Retail data analytics here means measuring sales, range, customers, and channels with enough geographic grain to compare regions and postcodes fairly. MapDemand.ai focuses on interactive sales data mapping from compliant uploads, alongside your warehouse, semantic layer, and scheduled dashboards.
Spreadsheets are precise for analysts who already know which rows matter. Dashboards compress KPIs for leadership reviews but often hide uneven regional shape unless someone builds custom map widgets. Maps in MapDemand.ai are intended to give commercial and ecommerce teams a geographic read on the same fields they already export, so you can triage questions before deeper modelling work.
Segmentation stays useful when postcode or region travels with revenue, order count, category, and channel. That framing supports location-aware segments without claiming to be a full CRM or customer data platform. Demographic overlays from third parties are not bundled today; any future enrichment will be optional and clearly scoped when it ships.
Plot concentration, tails, and quieter catchments from the same revenue and order fields you use in reporting.
Compare categories or SKUs across UK areas when your extract splits cleanly and definitions stay stable.
Separate web, marketplace, or store-linked orders when channel fields are reliable enough for geographic reads.
Layer permitted segment labels next to geography to discuss value pockets without exporting personal data you cannot use.
When territory or service area columns exist, relate them to sales maps for operations and commercial joint reviews.
Give finance, marketing, and trading one geographic frame so follow-up tickets reference the same grain as the map.
A pure-play ecommerce brand keeps a weekly dashboard of revenue and orders by region. Category tabs still look healthy nationally, yet footwear revenue is soft in two northern postcode bands while accessories over-index there. The analytics lead uploads the same extract to MapDemand.ai to show product-by-region shape on a map, then invites trading to a short workshop. The map does not decide the range change; it shortens the debate about where to look first.
Keep column meanings consistent with your warehouse and privacy policies. Clean postcodes and stable product hierarchies improve map quality more than extra columns alone.
Use these insights to support prioritisation, analysis, and follow-up modelling in your existing workflow.
Retail data analytics measures sales, range, customers, and operations. When exports retain postcode or regional grain, geographic analytics layers those measures onto a map so teams discuss demand in place rather than only in tables.
Spreadsheets stay flexible but row-heavy and slow to scan for spatial clusters. Dashboards summarise KPIs across time and filters yet often lose intuitive geography unless you build bespoke map tiles. Geographic analytics in MapDemand.ai is planned so you pan and zoom on maps built from the same CSV-style extracts you already trust.
Category performance can vary sharply across UK regions while a national scorecard still looks flat. Mapping product or category alongside revenue helps trading and marketing compare local demand shapes without claiming any single view decides allocation.
Yes when exports include geography alongside segment or customer keys you are permitted to use under your policies and contracts.
There is no bundled third-party demographic database in pre-launch. You can use compliant demographic attributes you already hold. Broader overlays remain a planned area as the product matures and are not required for useful retail maps today.
Typical fields include postcode, region, product or category, revenue, order count, channel, customer segment, date, average order value where available, and territory or fulfilment location when your stack provides it.
Yes. Clean order histories with postcodes are a strong fit for sales data mapping alongside existing funnel, ads, and warehouse reporting.
No. MapDemand.ai is designed as a geographic sales analytics front end for analysts and commercial users, not a full warehouse or semantic modelling layer.
Use the form below to get early access if you want postcode-level analytics views alongside your existing dashboards.